
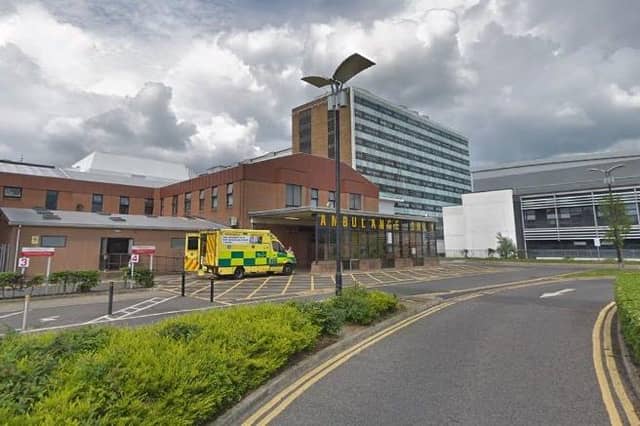

The DoH statistics provide the rate of ED attendances per 1,000-population for each Super Output Area in the North in March 2025.
The ‘Journal’ has looked at the Derry figures and found some areas recorded much higher per capita rates than others.
Here is a breakdown of the areas with the highest attendances in descending order.
The names of the SOAs do not always correspond to the names by which areas are popularly known.
The full data set can be viewed at: https://datavis.nisra.gov.uk/health/ni-emergency-care-waiting-times-interactive-jan-mar-25.html#attendances-at-eds
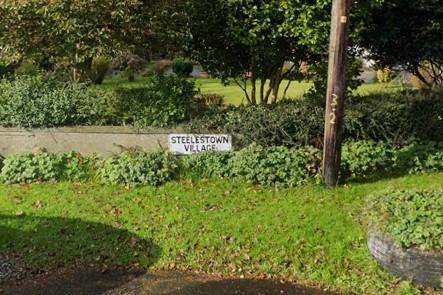
5. Culmore 3
Culmore 3, an SOA that includes Steelstown Village, recorded 21.3 attendances per 1000 people in March 2025. Photo: Streetview
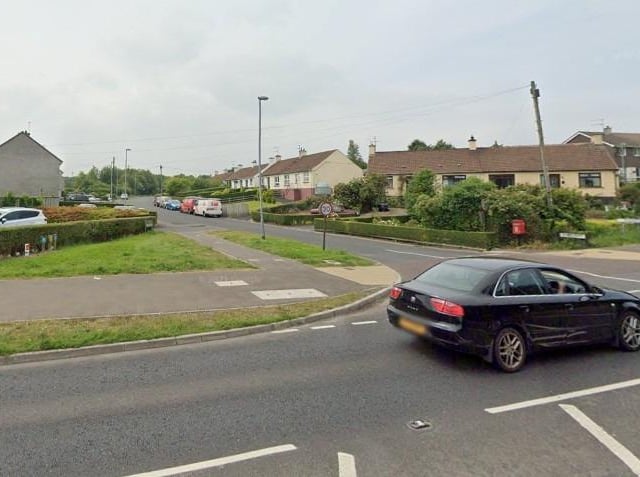
6. Culmore 5
Culmore 5, an SOA that includes Ballynagard, recorded 21.6 attendances per 1000 people in March 2025. Photo: Streetview
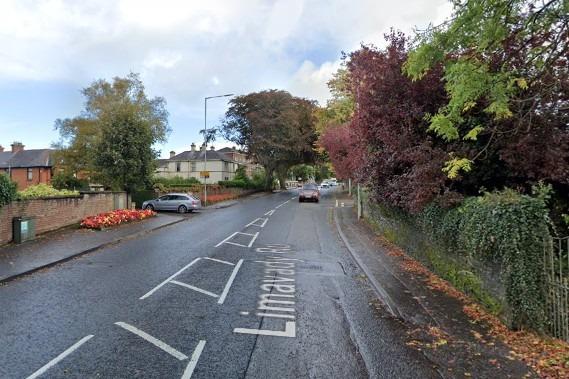
7. Ebrington 1
Ebrington 1 recorded 22.4 attendances per 1000 people in March 2025. Photo: Streetview
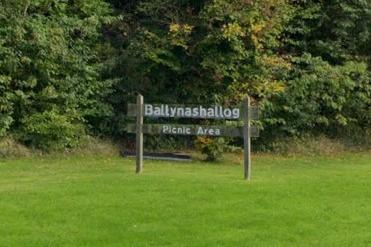
8. Ballynashallog 1
Ballynashallog 1, a tranche of land and housing either side of the Foyle Bridge on the cityside, recorded 23.1 attendances per 1000 people in March 2025. Photo: Streetview